
The Polls Agree Democrats Are Winning. They Disagree About Which Voters Are Driving Their Lead.
Four weeks out from the election, Democrats are well-positioned to win the national House popular vote by a healthy margin: FiftyPlusOne’s polling aggregation has Democrats ahead by 7.9 points and Silver Bulletin is modestly higher at an 8.9-point lead (or 9.6 points with their likely voter adjustment).1 While there is some variation in the results between Democrats holding a high single-digit advantage or a low-to-mid double-digit one, there is general consensus that the outlook is great for the prospects of a House Democratic majority and solid for winning back the Senate.
Yet, if you dive into the underlying data of any particular poll, you might find a completely different story as to how and with whom Democrats are winning in the generic ballot. After doing some analysis this past week, I found that there is a way of dividing the polls into two categories, and depending on which category the poll is in, someone could take away an entirely different story than if they looked at a poll in the other category.
Here are brief summaries of these two categories, and what one might take away if they looked at a poll in each one:
Category #1: Democrats are currently ahead in the generic ballot by 8 to 9 points, driven by more recent gains among women, Hispanic voters, and younger voters since polling conducted over the summer. Combined with winning independents by 20 points, they are likely to reassemble and possibly grow their 2018 coalition and go 2 for 2 in winning back the House majority during midterms when Donald Trump is president.
Category #2: Democrats are currently ahead in the generic ballot by 8 to 9 points, driven by more recent gains among men since polling conducted over the summer. Democrats are on track to win the national House popular vote at a level at or above 2018 because, combined with winning independents by 20 points and gains among younger voters, they’re on track to win men for the first time since 2008, offsetting lower shares of support from women and Hispanic voters they earned that cycle.
Though not entirely different—both find big gains among younger voters and have Democrats winning independents by similar margins—there are hugely important stories about gender and Hispanic/Latino voters that are pretty distinct from one another based on the category of poll you’re looking at.
Differences By Gender in Generic Ballot Polling Raises Questions About How the Polls Are Recruiting Respondents
My initial curiosity was a basic one: the lead Democrats had in polling conducted in September and October nearly doubled from a consistent 5-point lead over the summer to approaching 10 points lately, and I was originally interested in developing a clearer, multi-survey picture of where the shifts were most likely coming from.
I reviewed nearly 50 national generic ballot surveys conducted since the beginning of June, separating them into two buckets: more than 30 surveys conducted over the summer (June-August), and more than 15 surveys conducted since September 1.2 The basic average of these surveys found a 5.5-point lead for Democrats in the summer, which grew to a 9-point lead in the last few weeks. In the process of reviewing these surveys at a fairly high level, men were really sticking out: in virtually every survey I reviewed in September, Democrats were outright winning men. Some examples included Democrats ahead by 3 points in Marquette, by 7 points in both Quinnipiac and Marist, by 8 points in Angus Reid, and by 12 points in Emerson’s latest survey.
Democrats have won men twice before—barely—based on exit polls in the last 30 years: in the 2006 blue wave election (by 3 points) and in the 2008 presidential election (by 1 point). Notably, Republicans only won men by 4 points in the comparatively similar political environment of 2018, so the idea that Democrats could be leading among men does not completely strain credulity. However, the context of recent elections makes it a little harder to believe: in the presidential elections of 2020 and 2024, Trump won men by 8 points and 12 points, respectively; in the 2022 midterms, Republicans won men by 14.
There was also a notable counterexample: The New York Times/Siena University had a mid-September national generic ballot showing Republicans with a 4-point advantage. This survey had an 8-point overall Democratic advantage and a 19-point Democratic advantage among women; these shares neatly fit the shares of men (R+4) and women (D+19) supporting Democrats, and the final House popular vote in 2018 (D+8).
One thing I thought about at this point: NYT/Siena uses probability-based sampling, many of the other surveys were using online panels that are not probability-based, which as Cornell’s Roper Center for Public Opinion Research notes: “polls using [non-probability based online panels] are numerous and popular but risk bias as a result of surveying only that subset of the population who are online and oversampling those who are heavier internet users.”
So going another layer deeper was going to be required to understand whether this distinction was having any impact.
Two Categories of Surveys: Probability-Based (and/or Mixed-Method) Surveys vs. Non-Probability Online Panels
I initially classified these polls into three categories: probability-based, non-probability online panel, and mixed-method surveys, which recruit respondents via multiple modes (e.g., live caller, text-to-web, etc.) to reduce coverage error potential.3 I ultimately combined mixed-method with probability-based into one category because they largely behaved similarly and are predominantly probability-based, though I made some more nuanced classification decisions about individual surveys that sourced some interviews from non-probability online panels.4
This analysis created a divergent story of Democrats’ lead based on gender: probability-based surveys showed far more movement among women toward Democrats and something closer to a tie among men; in online panel surveys, not only had Democrats improved their standing among men by 6 points since the summer, there was effectively no movement among women.
Over the summer, each category was effectively reporting the same results by gender: Republicans led men by an average of 3 points in both categories, and Democrats led women by an average of 12 points in probability-based surveys and 13 points in online panel surveys.
In the latest surveys this fall, probability-based surveys show Republicans modestly ahead among men (by 1 point; only a 2-point shift since the summer) while men have shifted a net 5 points, with Democrats now holding a 3-point advantage on average.5
The divergence among women between the two categories is actually even starker. In probability-based surveys, women are now supporting Democrats by a 19-point margin, a net 7-point difference from the summer and an identical margin to the 2018 exit poll; in online panel surveys, they have barely moved at all (Democrats lead by 14 points among women now as compared to 13 points during the summer).
Another way to think about this: the gender gap—the distance between the net share supporting Democrats versus Republicans between men and women—was about 15-16 points, regardless of category during the summer.
Now, the gender gap is about 20 points in probability-based surveys and only 12 points in online panel surveys. For what it’s worth, the gender gap has been at least 20 points in each of the last six national elections dating back to 2014.6

Latinos Show Evidence of Even Wider Divergence Between Poll Categories; Independents and Younger Voters Do Not
I also looked across other demographics with what was publicly available from these surveys. Almost every survey reports findings by gender and because sample sizes by gender are among the most statistically robust, it was easiest to do that analysis. Fewer pollsters release other crosstabs, and when they do, there is inherently more volatility because of smaller sample sizes, inconsistent demographic breakdowns (e.g., one may report voters under 35 versus one that reports voters under 30), and so on. However, one other group that stood out where there were a number of surveys of both types in both the summer and fall was Hispanic/Latino voters.
In the last few weeks, there has been a dramatic shift among Hispanic/Latino voters toward supporting Democrats over Republicans in probability-based polling, while there has been effectively zero movement at all in online panel surveys. Over the summer, these categories were roughly the same with a near 20-point advantage in each category. Probability-based polls spiked to a 34-point margin in the fall (62 percent Democrats – 28 percent Republicans) while online panel surveys remained at an almost identical share as they saw during the summer (53 percent Democrats – 33 percent Republicans).

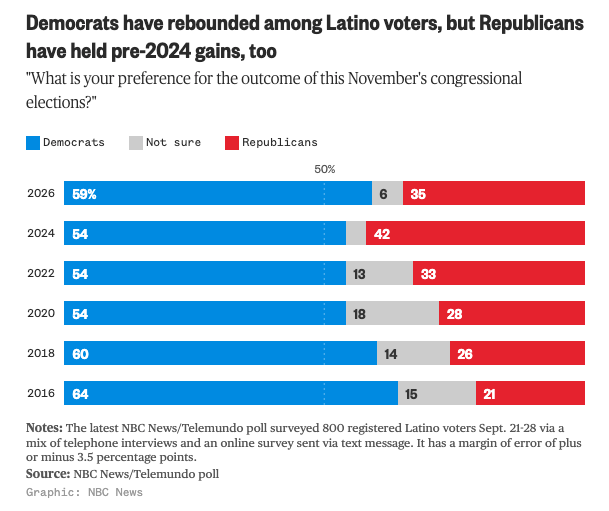
Over the weekend, Hart Research Associates and Public Opinion Strategies released a new survey for NBC News/Telemundo that used a probability-based and mixed-method approach (including live callers and text-to-web), notably with a much larger sample size of n = 800 Hispanic/Latino voters than would be found in any given nationally representative survey, and conducted 20 percent of the interviews in Spanish. This survey found a +24 Democratic advantage on the generic ballot, which does generally fit the idea that there has been a shift toward Democrats among Hispanic/Latino voters since the summer, but potentially not as much as the average of other probability-based polls might suggest.
Two groups where there is more agreement than not between these two categories of polls are independents and younger voters. Though there was a little more of a shift among independents toward Democrats in probability-based polls, both categories are reporting a similar 20-point advantage for Democrats now. Voters under the age of 30 have shifted toward Democrats in both category types, but the shift is ever so slightly higher in probability-based polling.
Being a consumer of this data is very difficult, especially when online panel polling is more pervasive because of factors like cost and speed (they accounted for over 70 percent of the surveys reviewed in this analysis!). Additionally, measurement error is part of this business even with the best, most methodologically defensible data. Wonky subgroup data should happen sometimes; if it never happened, that would actually suggest something was wrong.
The truth of where the race stands is probably somewhere in the middle of all of this, but I’m inclined to think it is much closer to the probability-based set of polls. Not only are they largely far more methodologically defensible, but they are generally exhibiting more of the kinds of trends one would expect in the current political landscape, particularly the size of the gender gap and the shifts toward Democrats among younger voters and Hispanic voters. But we’ll see: as G. Elliott Morris wrote last month about polling error in the 2024 election: “…high-quality non-probability firms actually did better than probability firms in the 2024 presidential election. If you grouped all probability and non-probability separately, probability samples missed the Trump-Harris margin by 3.3 points on average while non-probability samples missed by 4.1.”
We’ll all find out soon enough, but make sure and pay attention not only to who conducts a poll and its topline numbers, but how it’s conducted and what’s going on under the surface.
1 Data reflects their polling averages as of October 5, 2026.
2 Summer national congressional ballot averages include 32 polls conducted in June–August 2026, from 11 organizations: Angus Reid, Echelon Insights, The Economist/YouGov, Emerson College, Fox News, Harvard/Harris, Manhattan Institute, Marquette University, Pew Research Center, Quinnipiac University, and The Washington Post/Ipsos. September–October averages include 16 polls from 11 polling organizations: Angus Reid, CBS/YouGov, CNN/SSRS, Echelon Insights, The Economist/YouGov, Emerson College, Fox News, Marquette University, NPR/PBS News/Marist College, The New York Times/Siena College, and Quinnipiac University.
3 The summer window included 7 polls from 5 organizations classified as probability-based/mixed-method and 25 polls from 6 organizations classified as online panel surveys. The fall window includes 7 polls from 6 organizations in the probability-based/mixed-method group and 9 polls from 5 organizations in the online panel survey category.
4 For example, Marist College was included in the probability-based category because over 80 percent of their interviews were conducted via live caller and text-to-web, with about 19 percent coming from voter-file-matched non-probability online panels. By contrast, Emerson College uses an undisclosed number of non-probability online panel interviews and subgroup behavior exhibited similar behavior to other online panel surveys, so I placed them in the online panel category.
5 Republican vote share improved by 1 point while Democratic vote share improved by 6, which is why I said Democrats improved by 6 points but this data reports a total net 5-point shift.
6 It was 20 points in 2014, 24 points in 2016, 23 points in 2018, 23 points in 2020, 20 points in 2022, and 20 points in 2024.
